Alamance County, North Carolina
GIS Department
Disclaimer: THIS WEBSITE IS NOT A LEGAL DOCUMENT.
ALAMANCE COUNTY shall assume no liability for any errors, omissions, or inaccuracies in the information provided regardless of how caused; or any decision made or action taken or not taken by user in reliance upon any information or data furnished hereunder. The user knowingly waives any and all claims for damages against any and all of the entities comprising the Alamance County GIS System that may arise from the mapping data.
There are a few technical requirements you will need to meet in order to use this system. Also, if you wish to place the GIS Online system in your favorites, please use this page since putting the actual system in your favorites will cause it not to function correctly.
Alamance County GIS
124 W. Elm St.
Graham, NC 27253
For Parcel Questions
Contact Dale Jackan
336.570.4113
dale.jackan@alamance-nc.com
For Zoning Questions
Contact Emily Jones
336.290.8686
emily.jones@alamance-nc.com
For Addressing Questions
Contact Katie Harper
336.570.4085
katie.harper@alamance-nc.com
To talk to the Director
Contact Marlena Isley
Phone: 336.570.4102
marlena.isley@alamance-nc.com

Site Information
Basic Navigation
- Drag to pan
- SHIFT + Click to recenter
- SHIFT + Drag to zoom in
- SHIFT + CTRL + Drag to zoom out
- Mouse Scroll Forward to zoom in
- Mouse Scroll Backward to zoom out
- Use Arrow keys to pan
- SHIFT + Double Click to Center and Zoom in
- Click to Identify Features
- + key to zoom in a level
- - key to zoom out a level
Recommended Specifications:
- Mozilla Firefox or Google Chrome
- Microsoft Edge
- Apple Safari
- Microsoft Internet Explorer 10.0 or higher
Please note that your system’s processor speed, memory and internet connection type may also affect the speed at which GIS data is displayed.
Please turn off Pop-Up Blocker before using website tools.
Toolbar

 Click on the Zoom In tool on the toolbar and then drag a rectangle of area where you want to zoom.
 Clicking on the Zoom Out Button allows you to draw a box on the map and the map will zoom out by the ratio of the extent of the box to the extent of the map.
 Click on the Pan tool on the toolbar and then click on the map to move in the direction you want to go. You move the mouse in the opposite way from the direction that you want to go, so if you want to move the map east you click on the right part of the map and drag you mouse left, moving the map right.
 Clicking on the Zoom Full Button zooms the map out extent of the county.
 Clicking on the Zoom to Previous Extent Button zooms extent to the previous extent of the map. If you keep clicking on the button it acts as a back button. Do not use your browsers back button when using the application that will leave the page and end your session.
 Clicking on the Zoom to Next Extent Button zooms extent to the next extent of the map when you first changed the extent using the
  button.
 Clicking on the Clear Button, clears all the map graphics on the map and removes any search results that you may have had in the Report or Results window.
 Clicking on the Print Button brings up the print dialog. (See printing topic for more details)
Other Tools
Identify Tool 
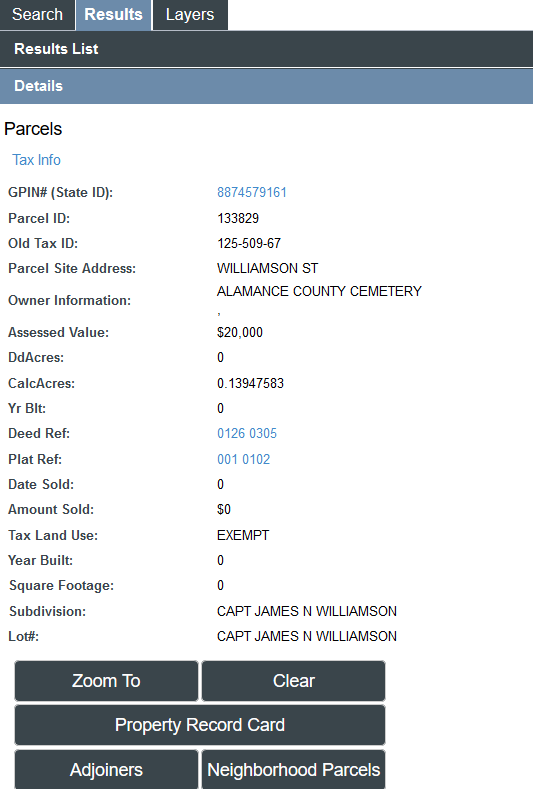
- Click on the Identify Tool on the toolbar and then click on the location on the map where you want to find GIS data. The Identify results appear on the left panel, in the Report window.
- In order to identify Parcel features on the map the layers need to be turned on.
Measurement Tool 
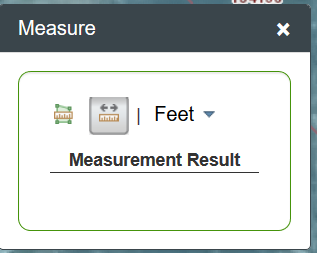
- From the radio button menu on the top, select the output units you would like. The default is feet.
- Choose whether you want to get measurements for the length of Line or an area of a polygon
- Start by clicking on the map
- Double click on the map when you want to finish.
- You can change the unit of measurement when you have completed the shape and the tool will display the new unit of measurement below
Cordinate Tool 
- The zoom to X/Y coordinate tool allows you to enter a coordinate and zoom to it
- You can enter the coordinates in either North Carolina State Plane NAD 83 Feet (which is the coordinate system that our GIS Data is collected and stored in)
- You can also enter the coordinates in Decimal Degrees or Degrees Minutes Seconds
- Use the radio buttons at top to select determine which method of entering the data you want to use.
- You can also use this tool to retrieve a map coordinate from the map when you click on it.
- Just click on the map and it will populate the control with your coordinate
- You can use the radio buttons at top to navigate between the display methods(State plane, Decimal Degrees and Degrees-minutes-seconds)
- By clicking on the options button you have a few controls that determines how the tool operates
-
- You can change whether the tool zooms to the coordinate point that you clicked on the map. The default of this tool is to not zoom.
- Another option is whether or not you want to label the point that you entered or clicked on. The default is to label the point.
- Another option is whether or not you want to only allow one point. The default is to only show one point, but you can uncheck this option to allow more that one point to show on the map, for instance, if you want to show the coordinates or each point on a parcel.
Note: All the coordinates are NOT survey quality and therefore only approximations.
Draw Tool 
Draw Tool allows users to add lines, polygons, points and text to the map
Buffer Point Tool 
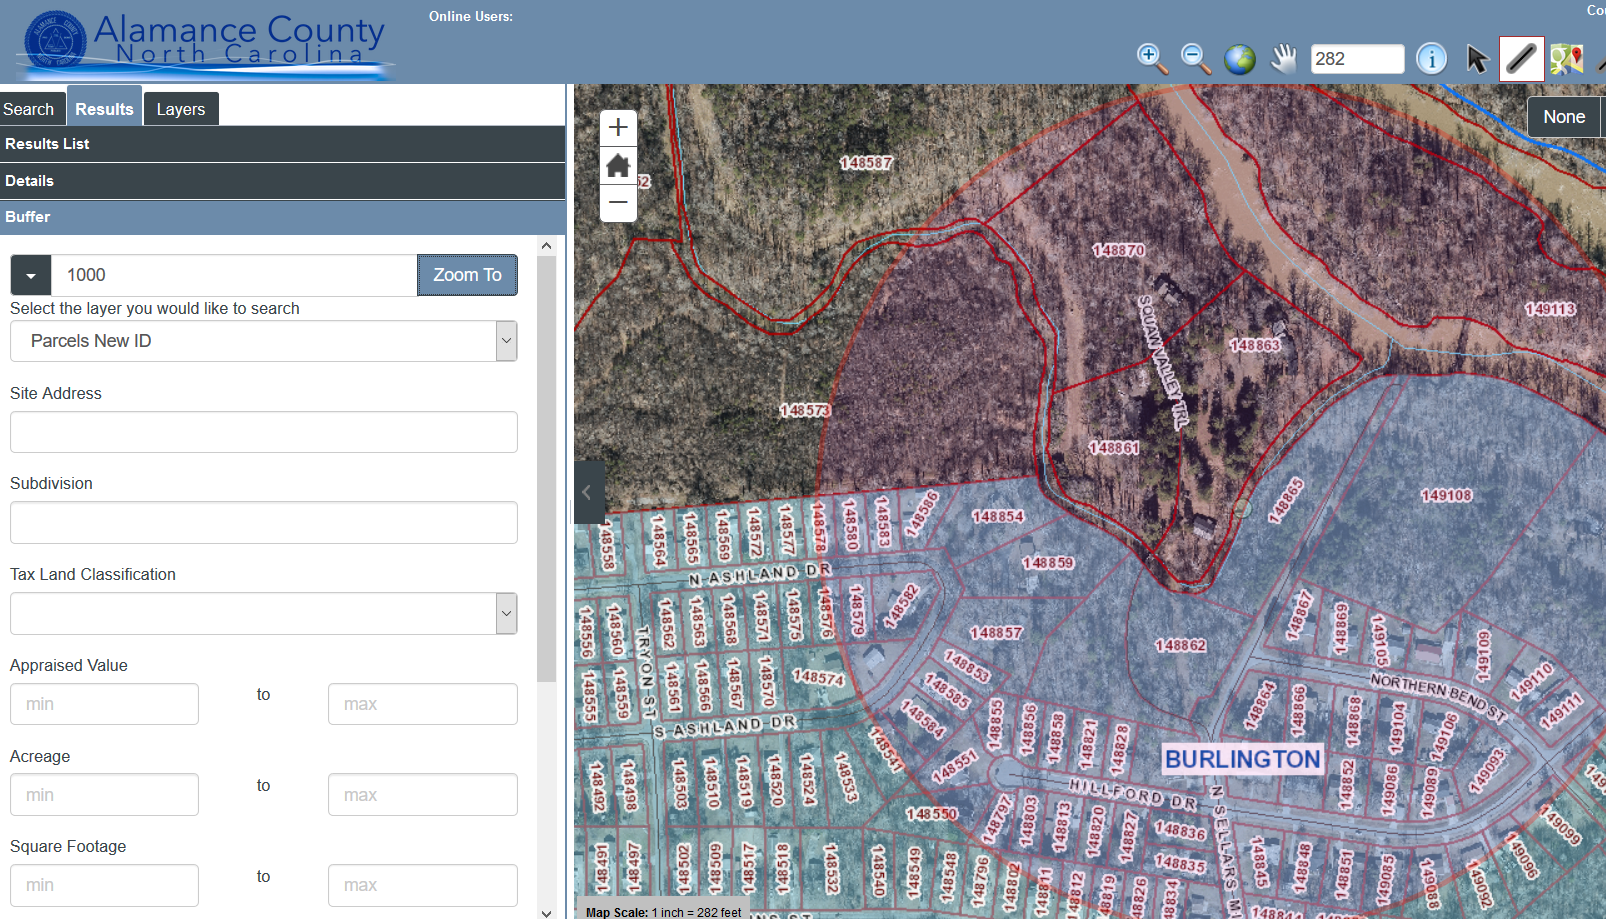
This tool allows a user to buffer a point by a given distance and select all of the parcels within the buffer.
- Click on the tool to activate
- Click the map location that you want to buffer
- A buffer dialog appears in the panel on the left hand side of the browser.
- You can buffer by feet or by miles. The default distance is in feet. To change the unit to miles cick in the arrow to left.
- Clicking the Zoom tobutton draws the buffer polygon and zooms the map extent to the extent of the buffer. It does not select anything
- Choose the filter criteria that you would like to apply (this is optional).
- Click the Searchbutton to execute the search.
Select Parcel Feature Tool 
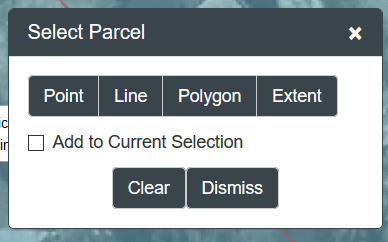
This tool allows a user interactively select a set of parcels on the map
- Click on the tool to activate
- Choose the method you would like to use to select
- Check the "Add to Current Selection" checkbox to add the selection to a selection set. Leave it uncheck to create a new selection set.
- The Extentbutton allows the user to select by a User defined rectangle. Click and hold as you drag the mouse. You will see an extent rectangle appear. When you let go of the mouse, the application select the parcels that touch the extent rectangle.
- The Pointbutton allows the user to select by a point. When you click the mouse, the application select the parcels that touches the point on the map. Use this tool in conjunction with the 'Add to Selection' Checkbox to select multiple non-contiguous parcels.
- The Linebutton allows the user to select by a line. Click on the map to start the line. You will see an line appear in red. Continue adding to the line by clicking on the map. When your selection line is complete, double click the mouse to finish. The application will then select each parcel that intersects that line.
- The Polygonbutton allows the user to select by a Polygon. Click on the map to start the polygon. You will see an polygon appear in red with a light grey to inticate the fill of the polygon. Continue adding to the polygon by clicking on the map. When your selection polygon is complete, double click the mouse to finish. The application will then select each parcel that intersects that polygon.
Printing
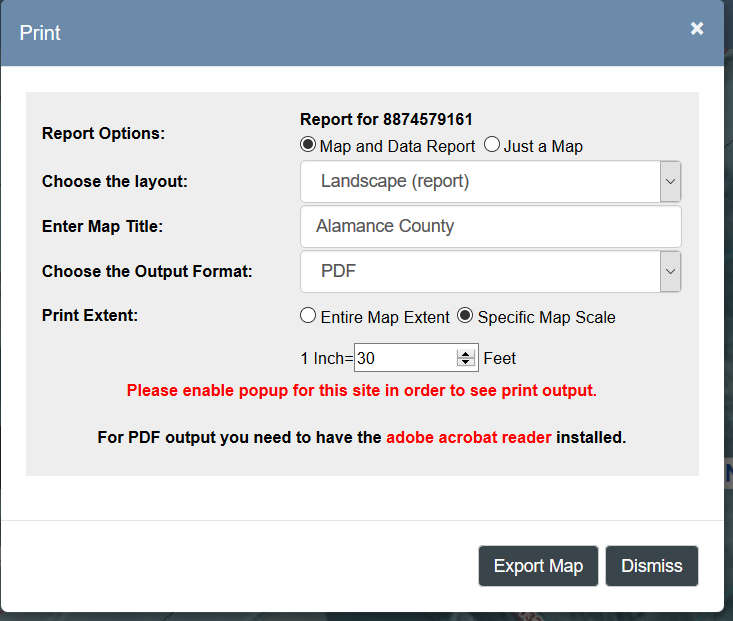
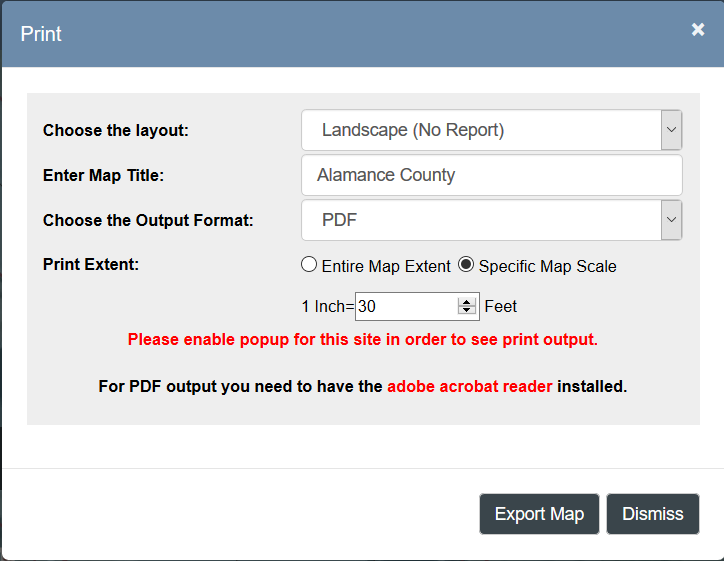
If no features are selected in the map, the print dialog will only show you the print layouts available that do not include a data report
By default, the output will be an Adobe pdf document, but if you would like the output to be another format then use the Output Format dropdown list to choose another option.
- PDF - Adobe's Portable Document Format -- This is a stand alone file. It works well for printing. If you need to integrate the output into another document then choose one of the other options.
- PNG32 - Portable Network Graphics -- this is a bitmapped image format that uses lossless data compression. This format can differentiate between 16 million colors and supports full alpha-transparency. This is the best choice if you are putting the output into a another document or you are printing the image with the Orthophotography on. The file size will be larger than the others since each pixel can contain up to 32 bits of information.
- PNG8 - Portable Network Graphics -- same as PNG32, but can only differentiate 256 colors.
- JPG - This is the most common image file on the web and stores 8 bits of color per pixel. Unlike the png, it uses lossy compression which results in some degradation of image quality. For most purposes, this loss will be imperceptible. This is a good choice for using in word documents or on the web.
- GIF - Graphics Interchange Format - This is another popular image format. It uses LZW compression technique to create a lossless image file that is small and portable without loss of data quality. This is another good choice for using in other documents.
- EPS - Encapsulated Postscript Vector graphics for use in Adobe Illustrator
- SVG or SVGZ - Scalable Vector Graphics (SVG)
By the caption Print Extent: there are two radio buttons.
The Extire Map Extent option means that the image will show take the current view of the map in your browser and attempt to show that entire scene in the printed document. In doing so, however, it will alter the scale of the map either zooming out a little or zooming in a little depending on the orientation and size of your browser window when you attempted to print.
The Specific Map Scale option will keep the same scale of the map or will zoom to the scale that you type into the scale text box. Basically, this will zoom to the center of the browser window and scale the map to the scale that you desire. The resulting image may not show the exact same scene as you see in the browser window. For instance, parcels on the periphery of the browser window may show more or less of the parcel in the printed document. The scale is in one inch equals X format which means that one inch of the printed map represents X feet on the ground. In mapping Map Scale is often depicted in feet, meaning 1 foot on the ground equals X amount of feet on the ground. For instance, the USGS Topo maps are 1:24K scale meaning one foot on the map represents 24,000 feet on the ground.
- 1 inch equals 50 feet is the same as a Map Scale of 1:600
- 1 inch equals 100 feet is the same as a Map Scale of 1:1200
- 1 inch equals 200 feet is the same as a Map Scale of 1:2400
Printing a map with parcel information
If you have a selected parcel feature in the map and that feature type that has a report, in this case Parcels, then the print dialog will display both the standard print layout without a report and the print layouts with a report.
- Enter a title, choose a layout format and output format
- The map scale is set to the current scale of the map.
- All print reports will open in another tab, so you need to have popup blockers diabled for this site. Please see the documentation for the browser that you are using to determine how to enable popups.
- The default output format for the print layout is PDF
Searching for Information
Basic Searches
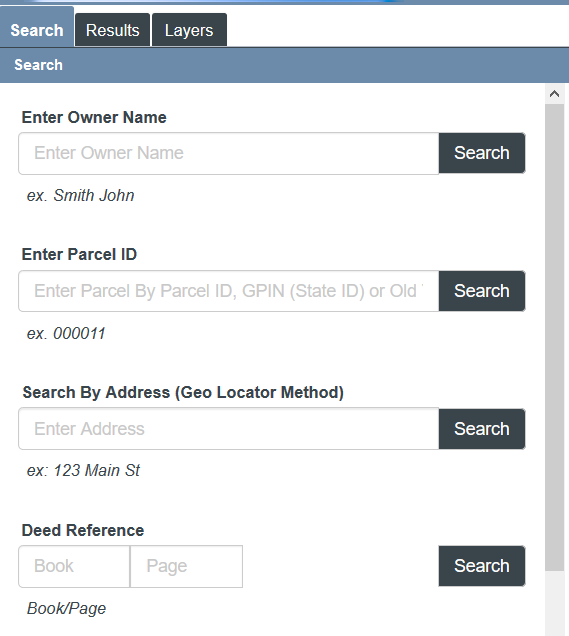
The Webviewer's primary focus is looking up parcel information, so the initial search panel has some common searches for looking up a parcels
Default Search- Enter the name in last name first
- Please include a common between the last and first names
- If search for last name and first name Do NOT include a space after the comma - for example: Smith,John
- A list of possible choices appear in the autocompletion box below the input box.
- You can either choose one of that list for a narrow search
- Or hit enter to do a wildcard search on the value you have typed.
- This is the unique id for our parcel data
- The GPIN is 15 digit number
- The Parcel ID is normally a six digit number
- The Old Tax ID is normally xxx-xxx-xx
- This is a search of any Address Point associated with the parcel
- This search first searches out Address Database for a record and then selects the associated parcel record.
- Information show is for the parcel not the address point.
- This is a search of any Deed Reference associated with the parcel
Advanced Search Tab
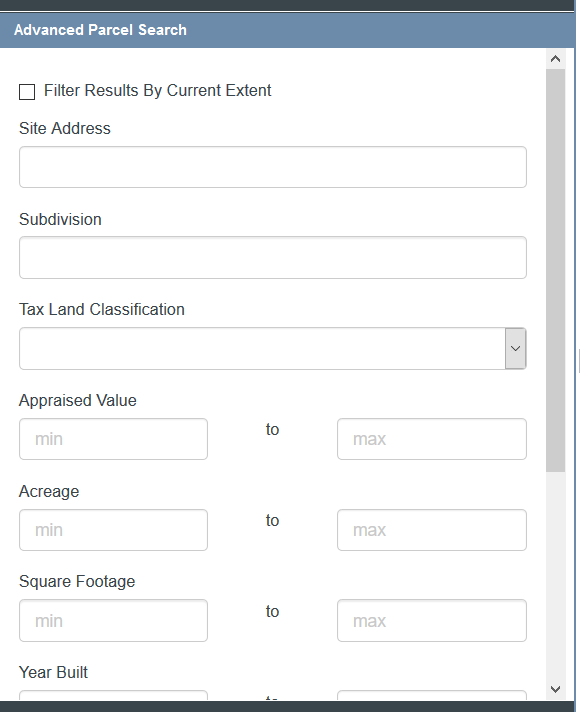
The Webviewer's primary focus is looking up parcel information, so the Advanced search panel is targeted to look for parcels using some of the other more common fields in our GIS System.
Notes
- Assessed Value is a numeric field, so please do not use characters in the search
- This search searches all the sales for a parcel, current and historical. Then it selects the current parcel associated with that sales record.
Buffer Tab
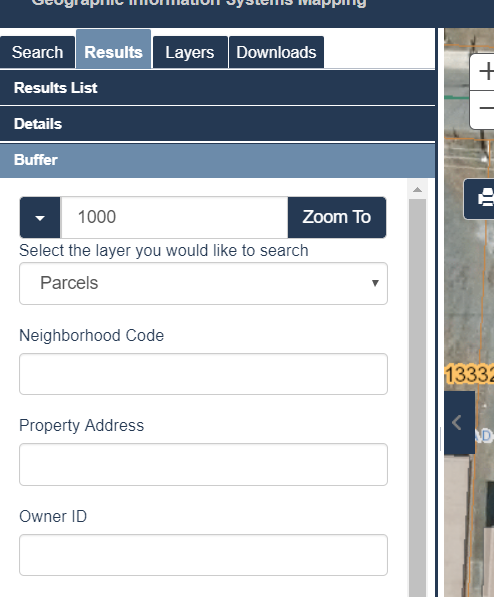
When you identify a parcel, if you click the "Buffer" button at the buttom of the Detail panel, a buffer panel appears on the left panel of the application. This is the same tool interface as as the Buffer Point Tool in the toolbar except that it uses the geometry of the parcel polygon to create the buffer. This tool allows users to buffer a parcel by a distance and query features based on a query.
General work flow for this tools is:- Find the parcel that you want to buffer either by using one of the search tools or by interactively
selecting the parcel on the map using the Identify Tool
 or select tool
  .
.
- Click the Buffer Button at the bottom of the Parcel Detail window.
- A buffer dialog appears in the panel on the left hand side of the browser.
- You can buffer by feet or by miles. The default distance is in feet. To change the unit to miles cick in the arrow to left.
- Clicking the Zoom tobutton draws the buffer polygon and zooms the map extent to the extent of the buffer. It does not select anything
- Choose the filter criteria that you would like to apply (this is optional).
- Click the Searchbutton to execute the search.
Search Results Panel
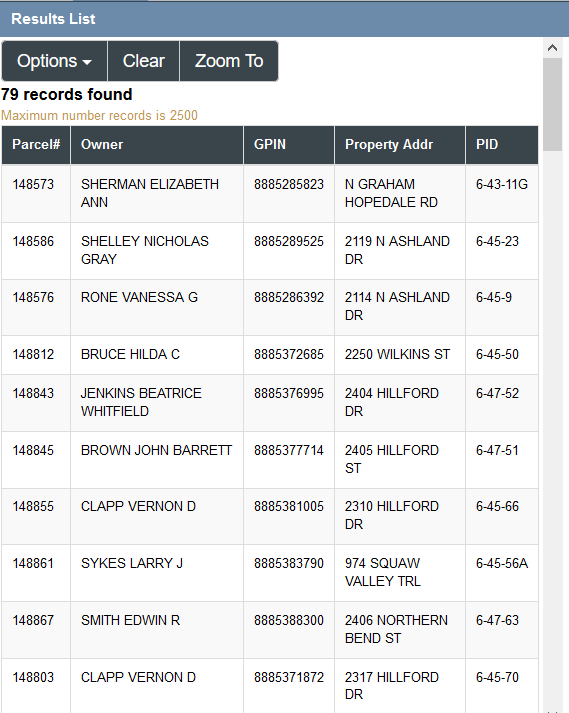
Once you execute a search, the search results will display in the Results Panel.
- Only 2500 records can be selected at a time
- You can export the records to a csv by clicking on the excel icon in the search results toolbar
- For parcels, we have formatted the results in a simplified manner, so to see all the data items for a parcel you'll need to click on the details link
- For other data, the results will be presented as a grid
- You can view the records as a grid dialog that displays in a modal window by clicking on the grid tool in the search results toolbar
- If only one record is found, the application will display the details panel by default
Tool menu for search results
Details Panel

The details panel display a single record in the database with all the fields
- You can either use the search tools or the identify tools to view records in the details panel
- If you are using the identify tool and you select more than one data item, the panel will have navigation buttons on the top of the panel to let you go through each record that you selected
- All results have a zoom to button and the feature will be highlighted on the map
- All results also have a clear button that clear the search results and the detail panel (this is the same as clicking on the clear button on the main toolbar)
- For a few layers, we allow you to buffer the feature and search for parcel that meet the criteria of the buffer (see buffer tool below)
- For Parcels, we also have an Adjoiners tool that will select all the parcels that touch the selected parcel
Also for Parcels there are a few additional tools at the bottom of the Details Dialog
- Land Report - Link to our Land Report web page. Arguments for the report is the ParcelID.
- Property Record Card - Link to the property record card for this parcel
- Select by Location (Buffer) - Takes the selected parcel and buffers it to make another selection (either parcels or structures)
- Adjoiners - Select all parcels that touch this parcel
Map Layers
Basemaps

You can change the basemap by clicking on the basemap buttons on the top right corner of the map.
These layers are always the bottom layer in the map
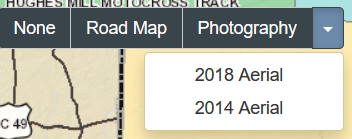
Additional years of Orthophotography can be accessed by using the dropdown button on the right side of the tool.
Additional GIS Layers
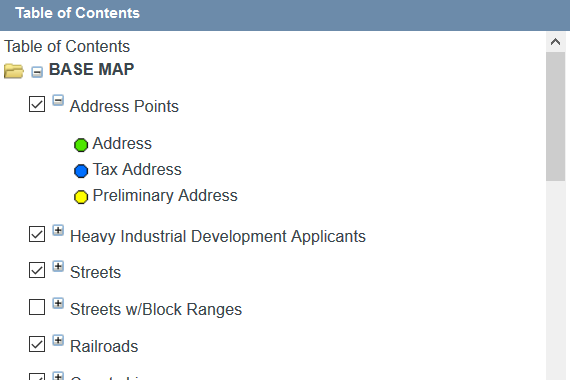
You can turn on and off any other layer in the map by using the table of contents panel.
For some layers, we allow you to adjust the transparency of the layer. Just use the slider bar to make the layer more or less transparent.
A legend will display below the item in the table of contents
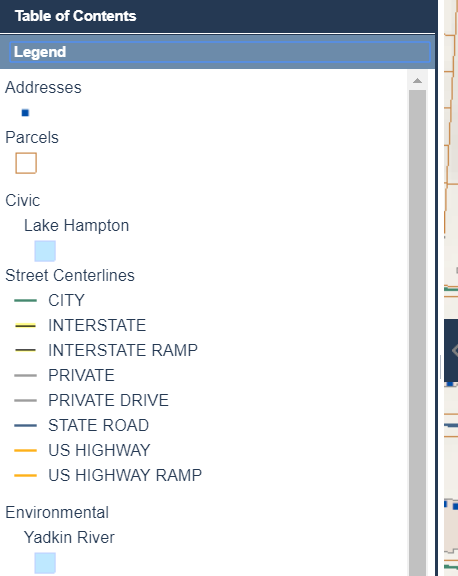
To see the legend without all the other control items, choose the legend panel in the Layers Tab
Additional Notes
In the desktop version of the Map Viewer, the information is normally displayed in the side panel. You can change the size of the side panel by moving your mouse to the area between the map and side panel. Once you see the splitter icon you can move the divider right or left to increase or decrease the size of the panel.
Use the Toggle Panel button on the side of the map to hide or show the side panel.
Note: If you identify a feature on the map, it will reopen a closed side panel to enable you to see the information.
Mobile Devices
The menu bar at the top of the device will toggle between the other sections of the application
-
brings up the Search section of the application. It is the same searches and functionality of the desktop application, but it is formatted for a smaller screen and only shows the search screens and not the map.
-
brings up the Table of Contents tool which allows you to turn on and off layers in the map.
-
brings up the map legend
-
will bring up a menu which allows you to view all the menu sections in the application including the ones above. You can use this to access the basemaps or the additional tools such as measure.
-
will clear any graphically selection in the application.
